Are the results of your A/B testing accurate?
Published: Jul 29th 2020 | 5 min read

A/B test is an important tool for optimizing marketing expenses. It provides information about the benefits of a solution without the interference of other factors. Moreover, it can lower the risk of exposure to the whole audience before you are sure that is the right choice for you. Especially if you want to compare two competing solutions, for example, two agencies offering you a different promotional solution, and you like both of them. It can be difficult to choose one only by looking at it. What had worked in the past may not be as profitable now. With A/B testing methodology you can evaluate if the more expensive proposition is really worth the premium you are paying for it. Or try a more daring idea to see the outcomes of the possibly high risk.
Data issues
However, to perform an A/B test you need to rely on the data needed for the analysis. To avoid systematic differences in the groups, random assignment of users to groups is generally preferred if the type of data allows it. Although, even with the random assignment, not all issues are solved yet. In particular, it is essential to check if the real shares of users in compared groups are not significantly different from their expected shares that are used in the evaluation. For the A/B test, there is no problem having groups that are not equally distributed, given that the smaller group has a reasonable amount of traffic in it. However, if you expect the groups to be divided into halves, assigning systematically one of the solutions to 55 % of traffic will distort the results of the A/B test dramatically. This is even more relevant for A/B tests with more than two groups for comparison as the individual shares can vary more relative to their size.
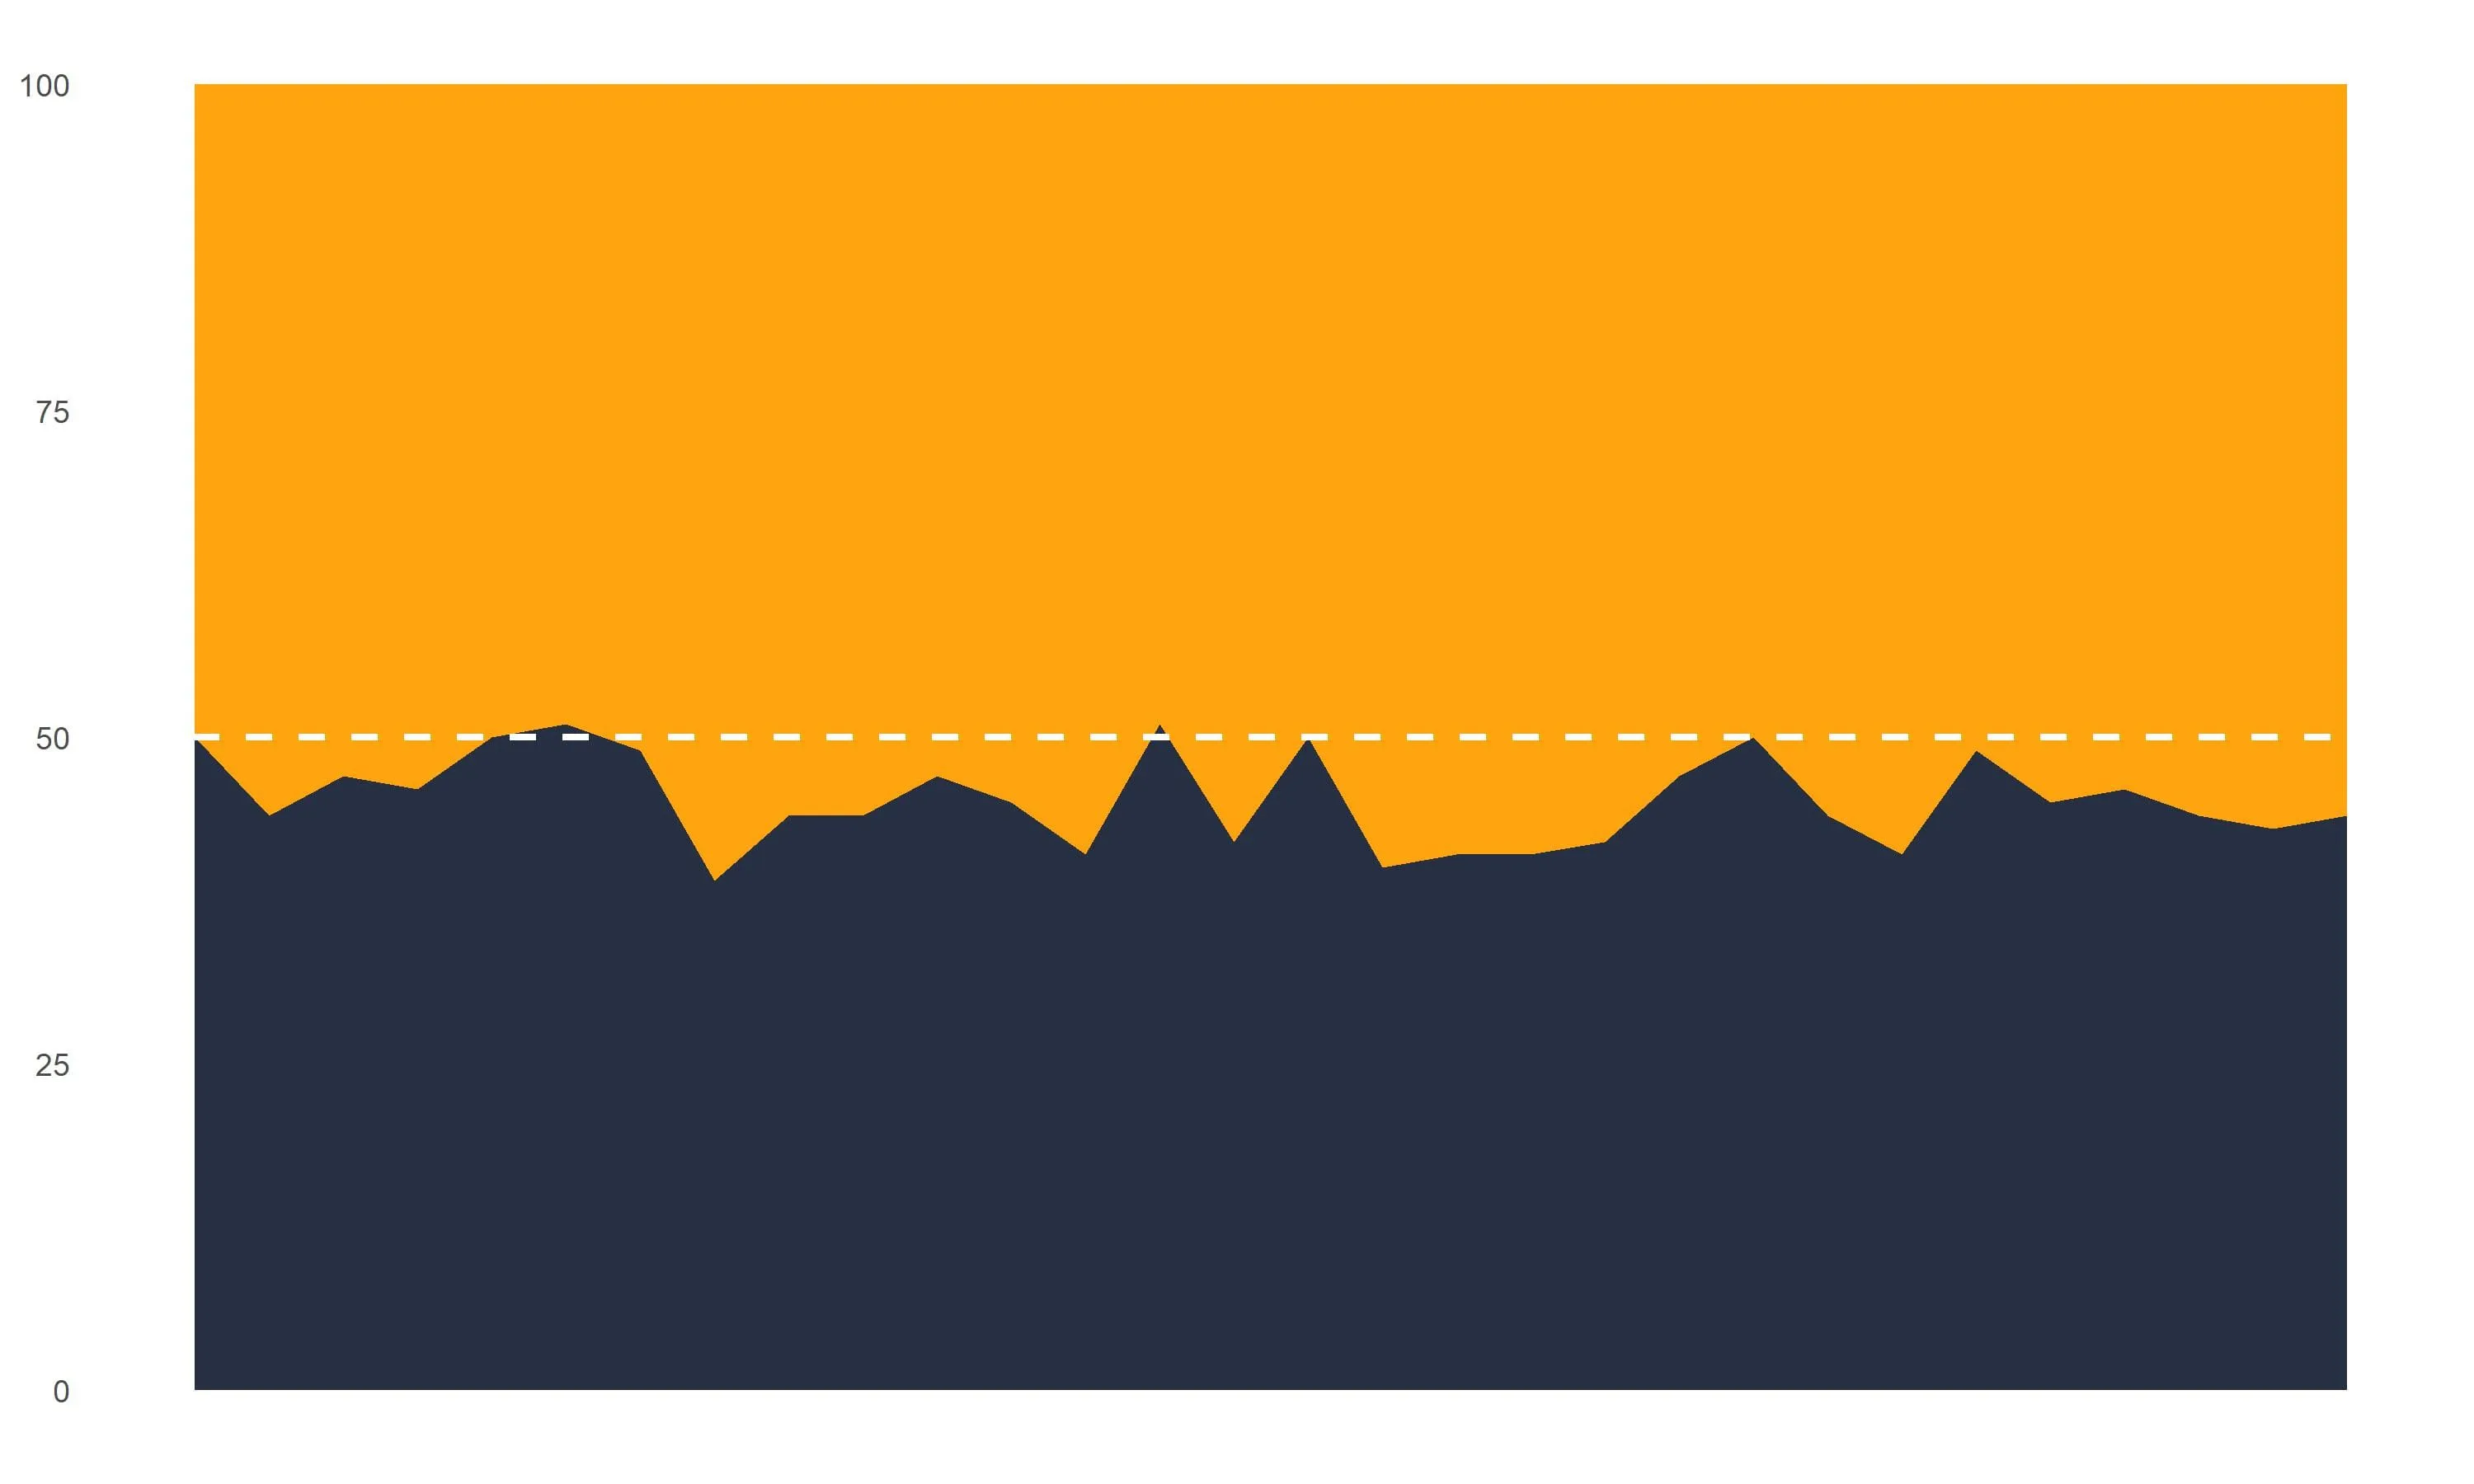
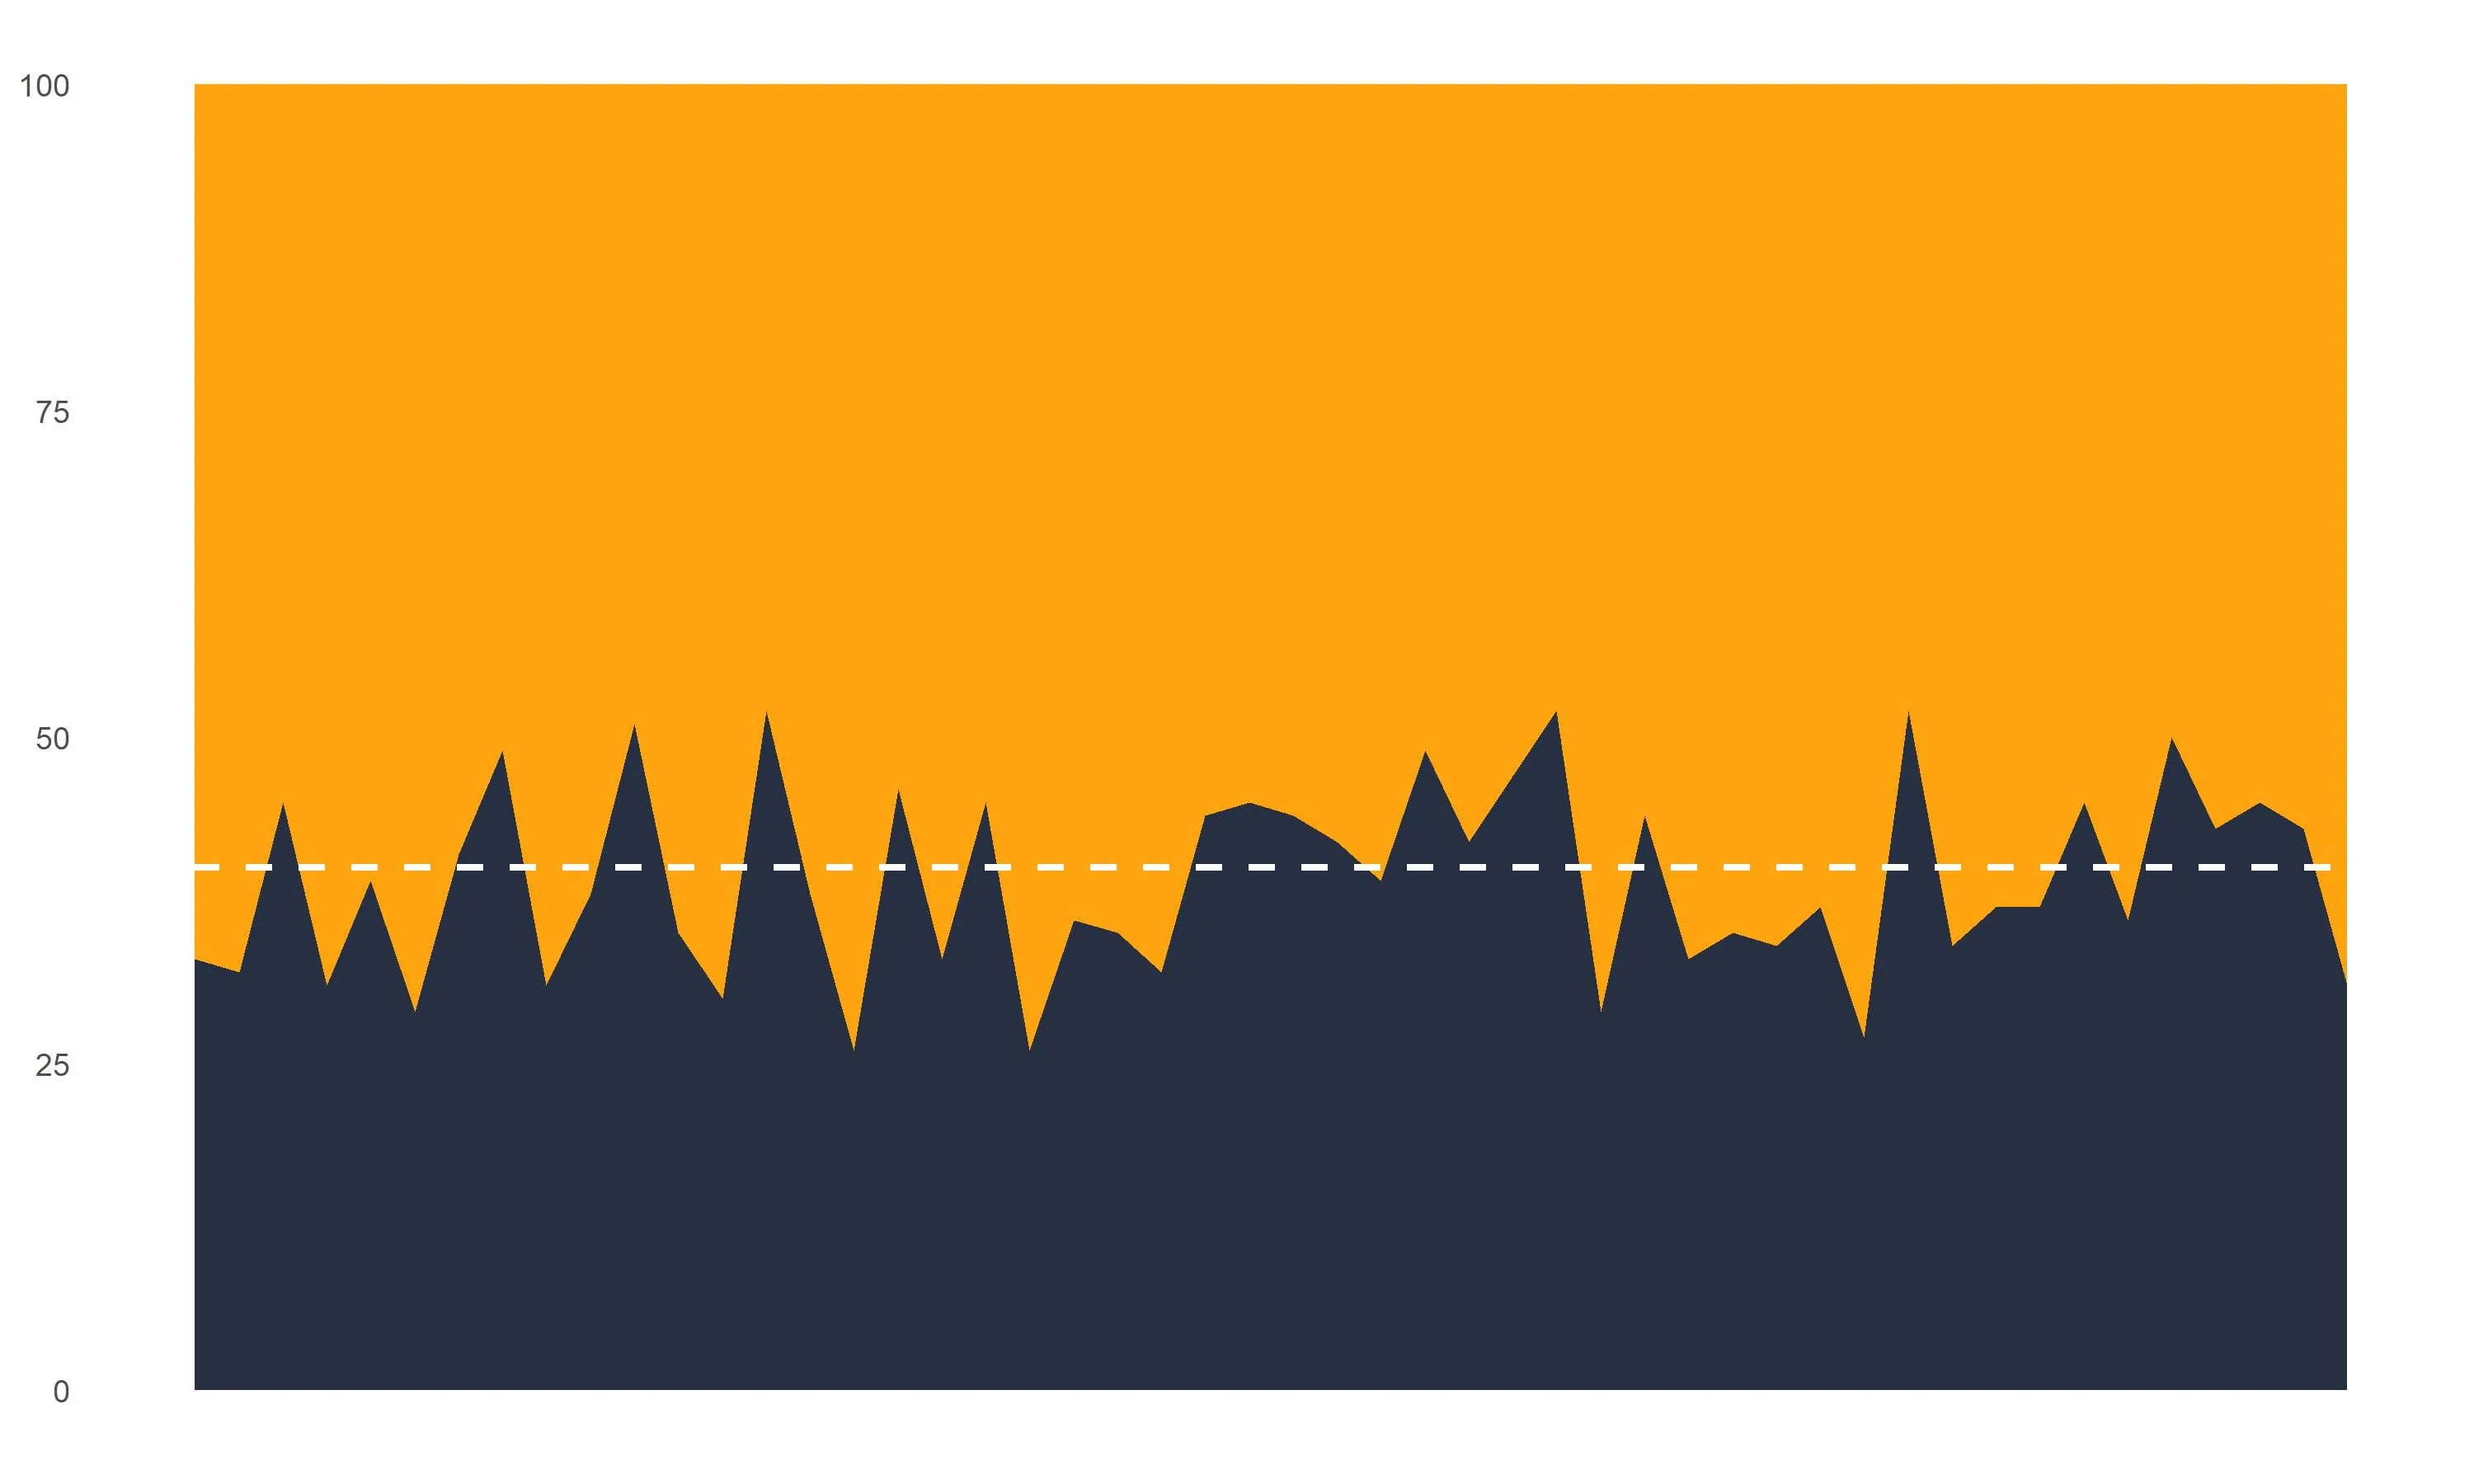
In practice, even with the use of random assignment, the data are rarely distributed by the exact share. When there is no problem in the data, the average over a long period of time should converge to the expected share. However, the real daily shares vary naturally around their averages depending on the volatility of the data.
Consequently, this unfolds two aspects of the issue of correct group distribution:
1. Check if there is no problem in the data causing the average shares to differ from the expected shares (e.g. due to implementation of the random assignment or due to sample in Google Analytics)
2. If you want to evaluate the A/B test on a daily basis, the results can be influenced by the fluctuation of data around their average shares.
How to approach the issue with the wrong distribution?
Over the years of practice, when we experienced similar problems in a few of our clients, we found two possible ways to approach this matter that works for most cases. Depending on the particular case and the testing frequency, you can check the difference between the real ratio and the expected one or you can choose to calculate daily shares.
Firstly, you perform a test whether the real representation of the groups is not statistically different from the expected distribution and in case of no difference, evaluate the test based on the expected distribution. This is mostly relevant for a one-time A/B test or an A/B test that is evaluated over an aggregated time period (for example weekly or monthly based on the size of the data).
Alternatively, you can approach the problem in a more systematic way. We use this approach in our analyses, especially in repeatedly evaluated daily A/B tests. In addition to other data necessary for the A/B test evaluation, we also collect daily data about new users that visited the client’s website. For these new users, we obtain data on their assignment to the test groups. Based on this data we calculate daily share for each test group as the ratio between the daily count of new users in the given group and the total count of all new users. This calculated daily share is then used instead of the expected shares of the test groups.
The systematic approach ensures that even on the basis of daily evaluation, the results are not affected by the differences of current share to the expected share for the given group. Furthermore, it ensures that no error in assignment to groups affects the results. This leads to more reliable and potentially stable outcomes that help you to select the better performing solution quicker and avoid miss-interpretation based on the wrong representation of the solutions among users.
Conclusion
To conclude, A/B testing should be a part of a decision process. It doesn’t matter if you are trying to choose between and agency or a different color. Especially, when the decision is strategic and can impact the business significantly, the verification of the results is crucial.