Google Analytics 4 – Ultimate Testing and Comparison Report
Published: Jun 29th 2021 | 26 min read
Table of contents
In this article, we do not provide any recommendations or conclusions only merely compare the various modules and functionality of the old Universal Analytics (UA) and the new Google Analytics 4 (GA4).
Google analytics 4 introduction and vision
This article is an extension of our previous article Google Analytics 4 - Brief Introduction And Vision. If you haven't read it, we recommend you read it before reading our comparison below.As Google Analytics 4 is still under development the content of this section is continually evolving and should not be considered final.
In UA, it is possible to create custom reports or dashboards. Dashboards do contain various elements like charts, tables, etc. Custom reports allow you to choose from three different kinds: a table with a time-series graph (Explorer), just a table (Flat Table), and a map (Map Overlay). The approach to customizations is different in GA4. It is not possible to build custom reports based on existing reports, which is very limiting and might certainly change in the future. It is not possible to add custom reports to already existing default reports. Dashboard functionality is missing in GA4 as well. The new option is to create analyses in Analysis Hub, which are suitable for power users. It is unclear to us why it is not possible to create reports from analyses, and we hope this will be added in the future.
| Universal Analytics | GA4 |
|---|---|
| Dashboards are available. | Dashboards do not exist, and we do not miss them. |
| Dashboard gallery. | Custom Reports do not exist, although this functionality can be mimicked to a certain degree with Analysis Hub. |
| Custom Reports are available; can be easily created from existing reports. | Exploratory Analysis in GA4 is amazing and can be accomplished in a new tool called Analyses Hub. |
| Exploratory Analysis reports are doable from BigQuery or API Query tools only - Data Studio, Power Bi or [Waaila](www.waaila.com). | Analysis Hub reports can be shared with all users within the property you have access to; reports can be shared with external users, although it is unclear why since there is no possibility to customize them. |
Views and filters
| Universal Analytics | GA4 |
|---|---|
| Everyone that uses Universal Analytics probably knows that the best practice is to have at least two views on each property: "Raw" without any filters and the "Master" or “Main” view used for business users. Additionally, we often use a “Test” view to assure changes are okay before doing them on the “Master” view. | In GA4 there are no views. |
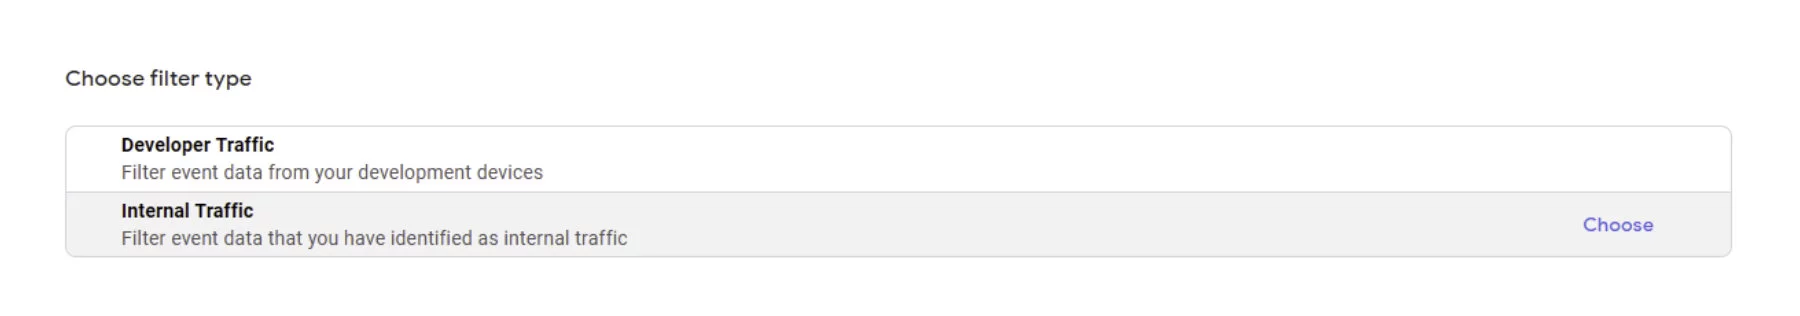
| Collected hits can be removed or modified with complex filtering functionality. | A very limited filtering functionality is available. We believe this is not the final set of filters and that it will be enriched in the future. At this moment it is only possible to remove internal or developer traffic. It is not possible to filter based on dimensions. |
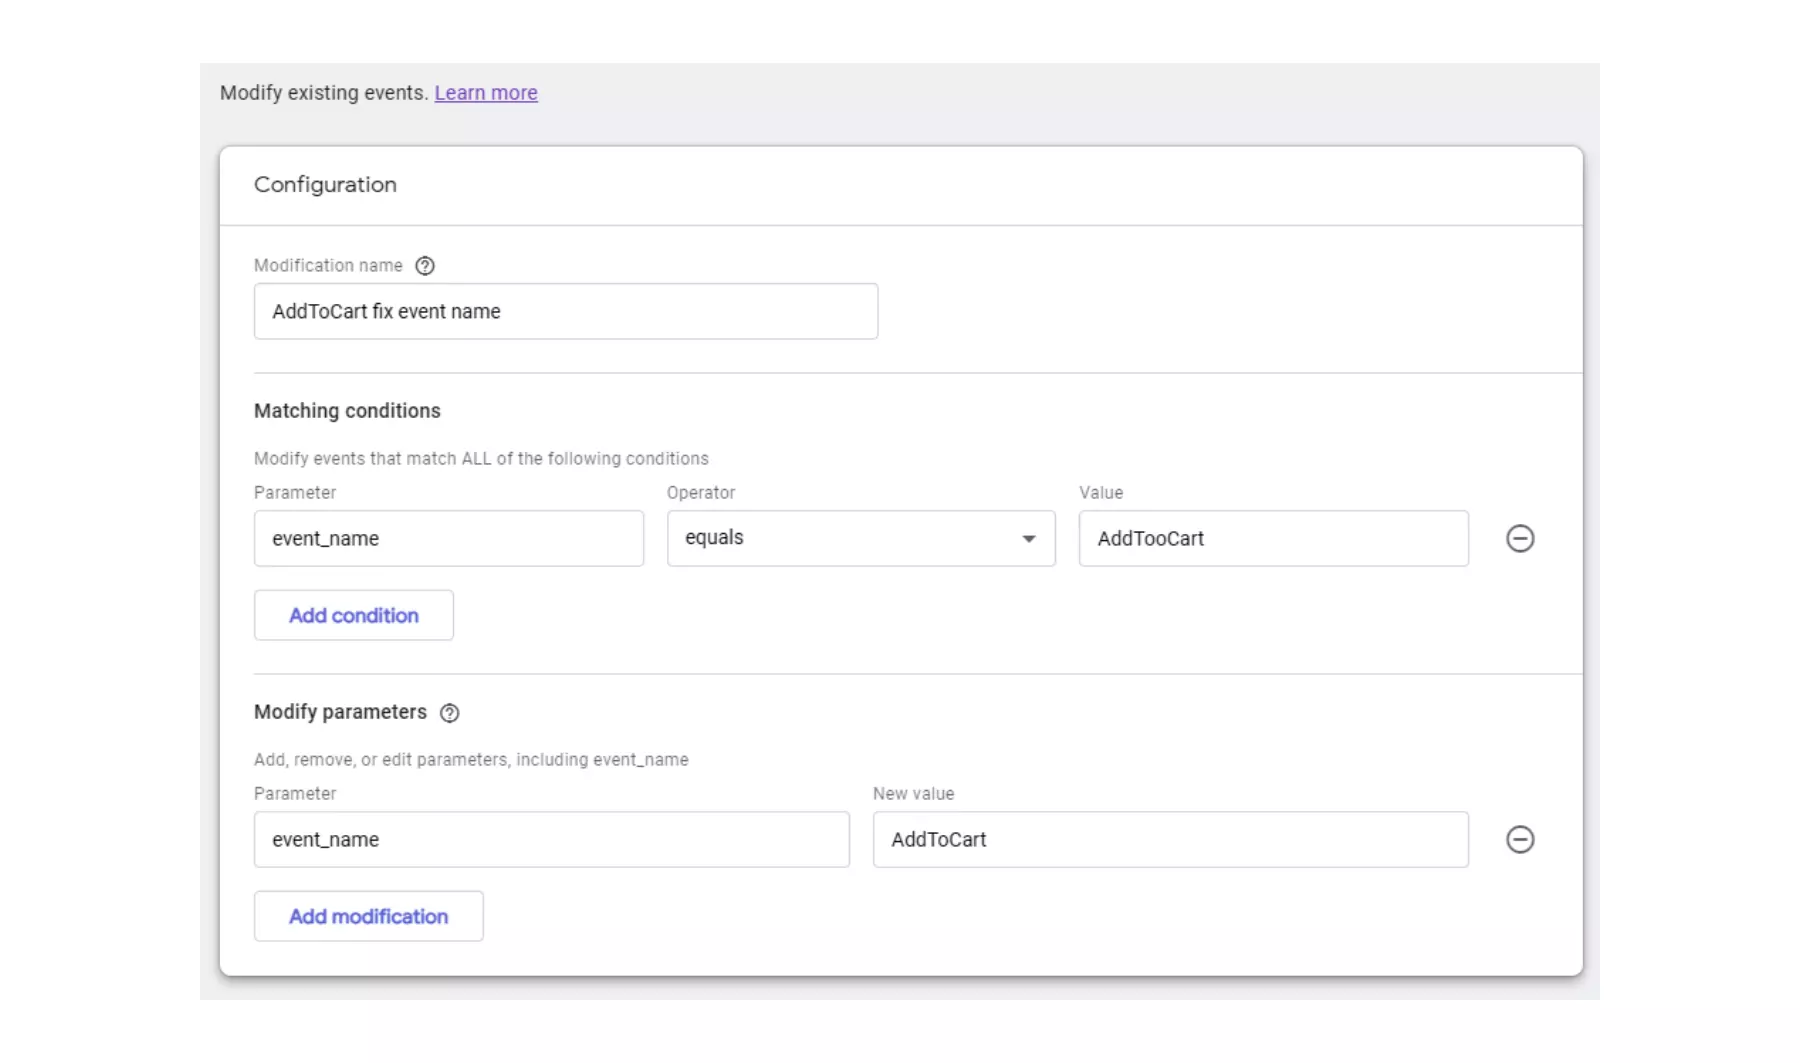
Filters are no longer used to modify collected data. A new approach to modify collected events has been introduced, and we believe this tool will have much greater potential in the future. At this moment it is only possible to replace some data with a constant value and not allowing any data-driven transformations.
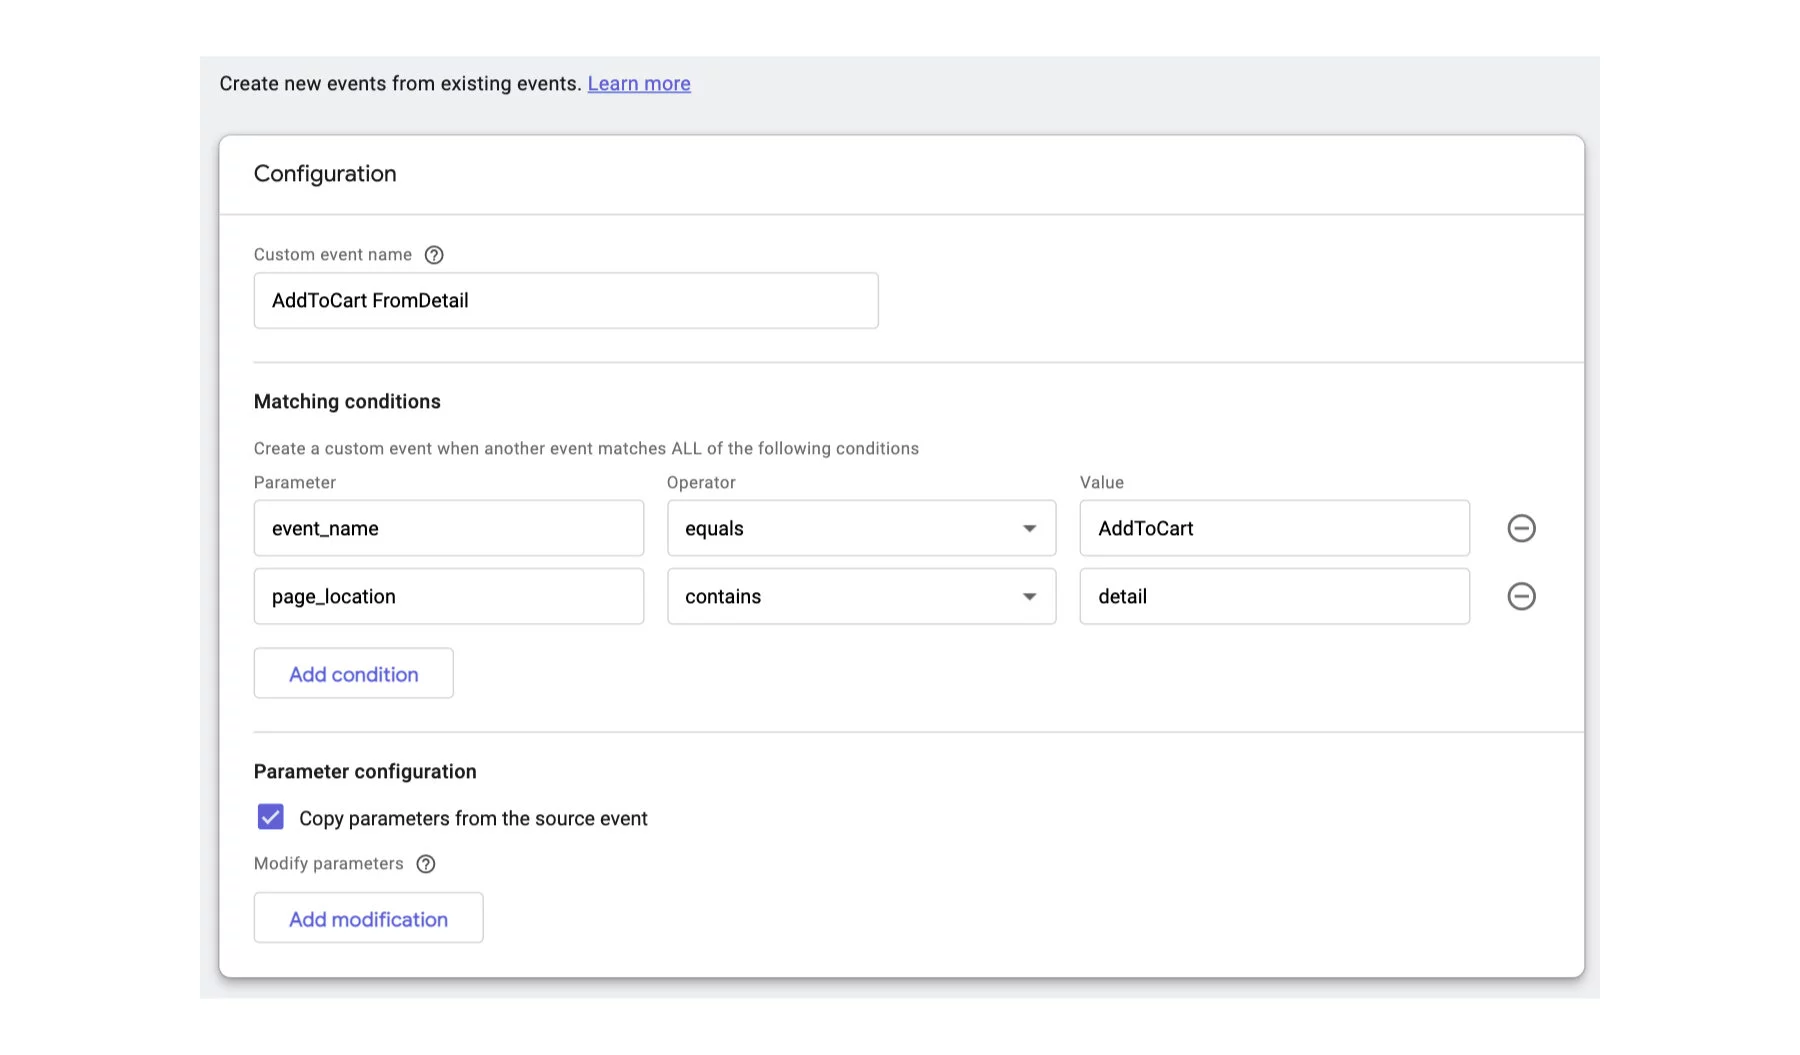
New event creation functionality allows deriving events from already collected events. This is a desired functionality, which is available in any professional Web Analytics tools, that allows event enrichment configuration in the user interface. If this functionality will be further enriched it will not be necessary to modify the web measurement or modify events in BigQuery.
Removing views that were used for testing filters before applying them to the production view is not possible. It is uncertain how Google is planning to do Quality Assurance without damaging production data. One approach might be to send data in parallel to another property, which could be accomplished by Connected Site Tags when using gtag. For another kind of implementation, it would be more complicated than before.
Session
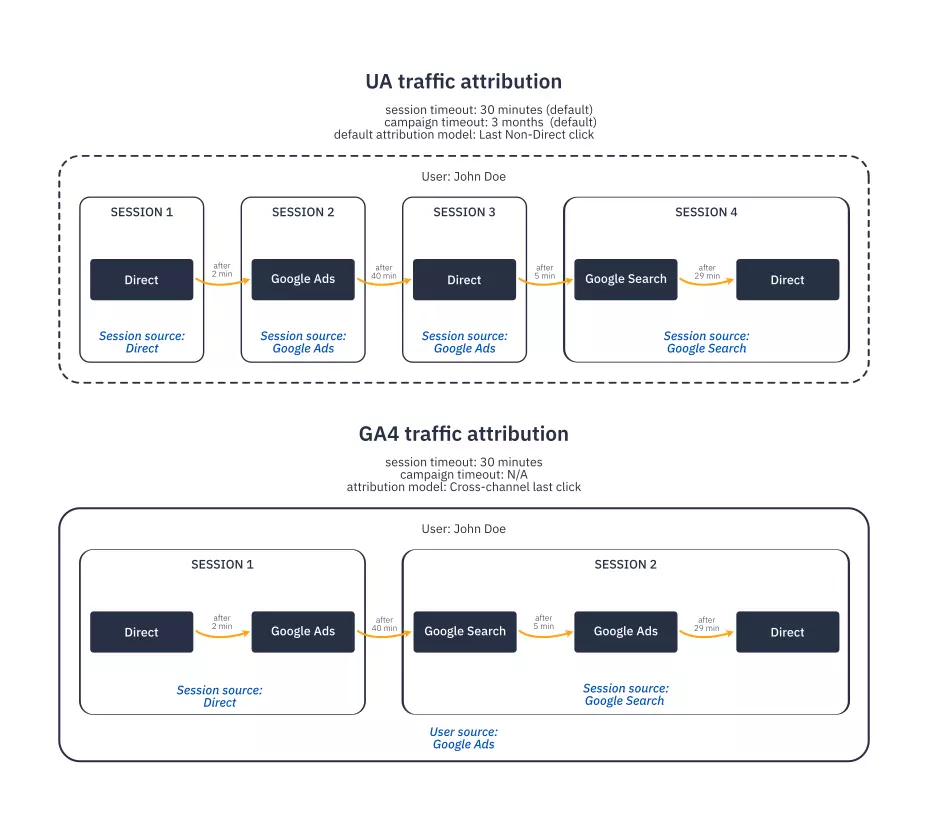
The Session is so special that each Web Analytics tool treats it differently. The basic rule is that it expires after 30 minutes of inactivity (it can be configured). However, it can expire in some other situations as well and this where most of the differences pop up. We can assure you that sessions between GA4 and your existing GA implementation will differ, and it makes no sense to align them. You will need to invest a lot into educating others about what has changed, especially to those who consider Universal Analytics as the golden standard for acquisition analysis.
| Universal Analytics | GA4 |
|---|---|
| A Session is interrupted at midnight, so the maximum session length might be 24 hours. | A session is not interrupted at midnight, and it has no time limit, e.g., someone who interacts with the web every 5 minutes might have a year-long session and still be in their first session. |
| A Session is interrupted after a defined time of inactivity (session timeout) and is configurable (between 30 minutes and 4.5 hours is the default). | Session timeout is set for 30 minutes (timeout is configurable only for an app). |
| A session is interrupted when the source changes. | A session is not interrupted when new source changes. |
| - | The Engaged Session is introduced. |
Traffic attribution
Traffic detections in both versions are based on UTM parameters or GCLID (Google Click Identifier or known as Google Ads ID) in the URL.
| Universal Analytics | GA4 |
|---|---|
| UA has 5 default dimensions: Source (utm_source), Medium (utm_medium), Campaign (utm_campaign), Content (utm_content), and Term (utm_term). | With GA4, Content (utm_content) and Term (utm_term) are missing. It might be that these will be added in the future, as the tracking script is parsing them. Now it is possible to read them from event parameters and map them into custom dimensions. Interestingly, the term parameter is already available in the BigQuery export for organic traffic. |
| Campaign Code (utm_id) and campaign imports are possible. | Campaign Code (utm_id) is missing and campaign imports are not possible. |
| Campaign attributes are stored on the sessions level only. | Events are enriched by calculated acquisition attributes, which are taken from source parameters. The Campaign, Source, and Medium parameters have a value for each model - For example: Event Campaign {model}. |
| It has default and custom channel grouping. | Only Default channel grouping is available, whereas custom channel grouping cannot be set. |
| It has campaign timeout, which is the time that the campaign could be attributed to the user's subsequent sessions from the time that the user comes from this campaign (by default, it is 6 months, and_it is customizable). | Campaign timeout does not exist. |
| UA has a default attribution called Last click (non-direct) and selection of several basic attribution models. | The default attribution is the Last click (non-direct), and there are three other models (biased towards google). |
| - | New calculated user-level acquisition dimensions are available. For instance, User Campaign (the first campaign of the first session), though of course it is calculated with Google’s “attribution” model. |
Although it looks like the reporting sources settings are similar, the results will be very different. It is mostly due to the different session definitions and missing campaign timeout.
Custom dimensions and metrics
As you probably know, there is a big difference in the number of custom dimensions available in the free version of Universal Analytics and in its paid version (GA 360). GA4 has added more dimensions than to the previous version. In addition to this, GA4 has separated the collection logic (event parameters) from reporting logic (dimensions/metrics). Event parameters can be mapped to dimensions or metrics.
| Universal Analytics | GA4 |
|---|---|
| 20 custom dimensions available over 4 scopes: Hit (event), Session, User, Product | 50 event scoped dimensions and 50 event scoped metrics, comparable to dimensions and metrics in UA at hit scope 25 user scope dimensions comparable to dimensions in UA at user scope |
| 20 custom metrics | Metrics can have assigned units |
| 5 custom content groups per view | - |
| 3 default dimensions for an event (Event Category, Event Action, Event Label) | 500 unique events (Event name) excluding default events – we no longer use the classic classification of 3 dimensions (Event Category, Event Action, and Event Label) for events. However, nothing prevents us from creating a similar structure using event scope dimensions. Thanks to customization, you can significantly adapt it to your needs. |
Segmentation
Universal Analytics
Universal Analytics used Segments as the default segmentation logic across all reports and even in the API.
-
By Segments
Anyone who uses Universal Analytics more intensively for exploratory analysis gets the benefit of segments (unless you have a lot of data where sampling makes this feature useless). Segments can be used in UA in any report, whether it is a default report or a custom report. The Segment must be created and saved before being used. The Segment may be applied to historical data. Segments might be shared across properties.
-
By Audiences
Audiences are similar to segments with one important addition, in that they can be distributed to other systems (Google Ads) and are linked to the current property. It has a membership duration, the time for which users in the given audience are kept.
GA4
GA4 has introduced various segmentation approaches and has simplified certain features for daily reporting tasks.
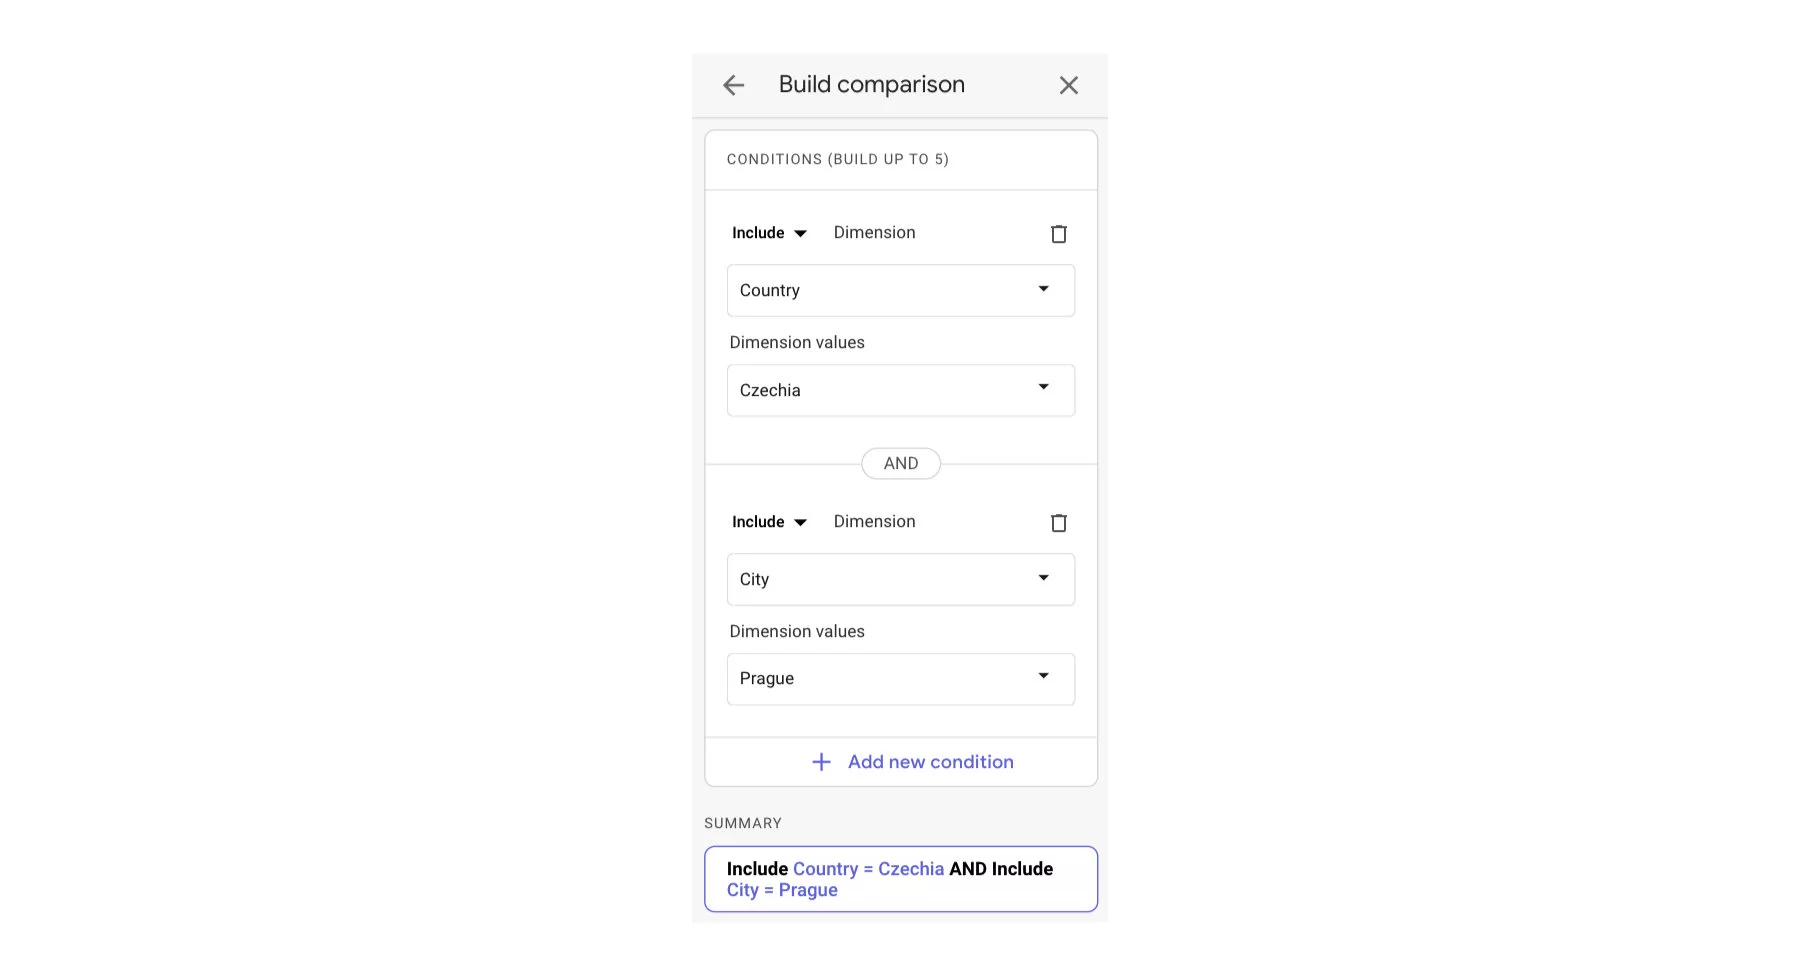
- By Comparison
It might be that we stick to the previous approach of Segments from UA a bit too much and expected the same functionality from comparisons. This is not the case. You can, in comparison, do very simple segmentation based on dimensions. There is no option to do sequences, etc. If you would like to do it, you have to first define the audience and then use it in there. This is a bit more complicated and is limiting as well because the audience does not look backward. If you used segments a lot, you might not like it.
-
Segments in Analysis Hub
In case you would like to compare the behavior of two segments in the past, the only option is to use the Analysis Hub. You can create a custom segment within the custom reports, which can be saved. Unfortunately, any segment that is created is just saved in the analysis and cannot be shared or reused, unless you create an audience from it. We believe this is just a bug and will be fixed later. -
Audiences
Audiences have the same meaning, usage, and a similar creation interface as Segments in UA. It looks like they are meant to be used as Segments. So be careful! They start collecting data from the moment you create them. Audiences can be shared with Google Ads.
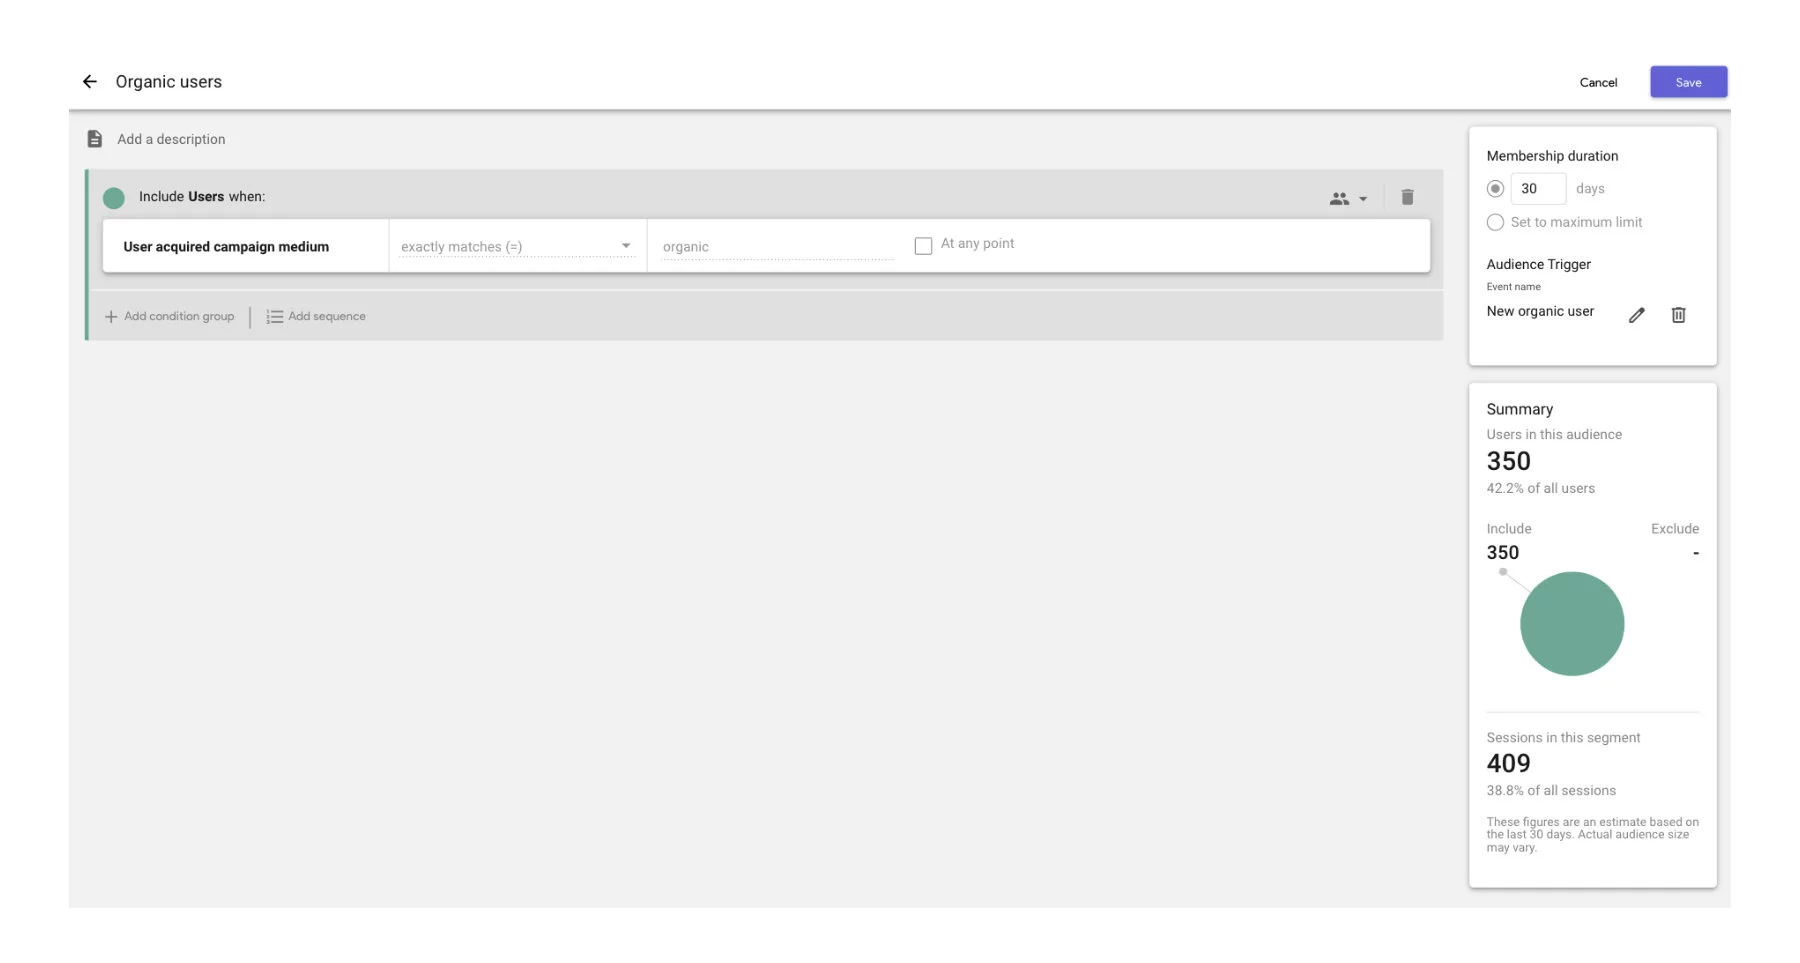
You can easily use predefined audiences for segmentation in any reports using the Comparisons functionality mentioned above.

Because of the Audiences limitation for historical comparisons, we suggest creating them early on. Think carefully about what you will need because once created, an Audience cannot be updated. Since Audiences are always calculated after they are created, we believe the sampling issues will go away.
Sampling
Sampling means that your metrics are estimated based on a sample (random subset) of your data. For anyone who analyzed bigger accounts, this causes a constant headache. Combining more dimensions with segments often resulted in making completely wrong decisions. Even the paid version is not much better at avoiding sampling issues and the option to export data to BigQuery saves it. GA4 offers to export to BigQuery by default, so we expect that any sampling issue will be addressed by the export as well. Actually, that opens an interesting question of what would be the real benefit of a paid version if such exports are now possible in the free version. It might be that the revenue stream generated by the Google Cloud consumption from GA users will surpass the revenue from the GA 360 version.
| Universal Analytics | GA4 |
|---|---|
| The interface and simple reports are okay, but using customized reports, adding custom dimensions, or segmentation by segments has resulted in terrifying sampling errors. | The interface, simpler standard reports, and inability to use calculated Segments will most likely not cause sampling issues. As for Analysis Hub, we expect it to be better tuned for processing complex queries and avoiding sampling issues. |
| With the API, even on very large data sets, it is possible to retrieve unsampled data. | With the API, we do not expect much change here compared to the UA API. The cost of queries, however, is calculated differently and other limits are applicable. There is no longer the need to use API to export all data. |
| Exporting data view API querying, and cross-dimension combination, mostly by third-party tools, allowed for the export of unsampled data. | The Data Exports Option to export unsampled data to BigQuery is for free. This is a killer feature. |
It is very difficult to compare sampling as data are queried differently. In general, we expect the GA4 sampling issues will be less frequent. The possibility to export data to BigQuery is an amazing feature that makes GA4 very actionable and opens wider customizations in Data Studio or other visualization tools.
Goals / Transactions / Conversions
Conversions in Universal Analytics are either Goals or Transactions. In GA4 the approach is similar, as conversions are just special events (like a purchase) or any other event you say is a conversion (checkbox in the menu). In Universal Analytics, conversions are created after you configure them and enable recording, which is similar to the GA4 interface.
| Universal Analytics | GA4 |
|---|---|
| UA has 20 custom-based goals. | GA4 has 30 custom conversion events, and any event can be marked as a conversion. |
| Goals can be based on a destination (URL), Duration, Pages per session, and Smart goals. | You cannot set goals based on Duration, Session Aggregates, or Smart goals, but you can create a conversion based on any event parameter, dimension, or metric. |
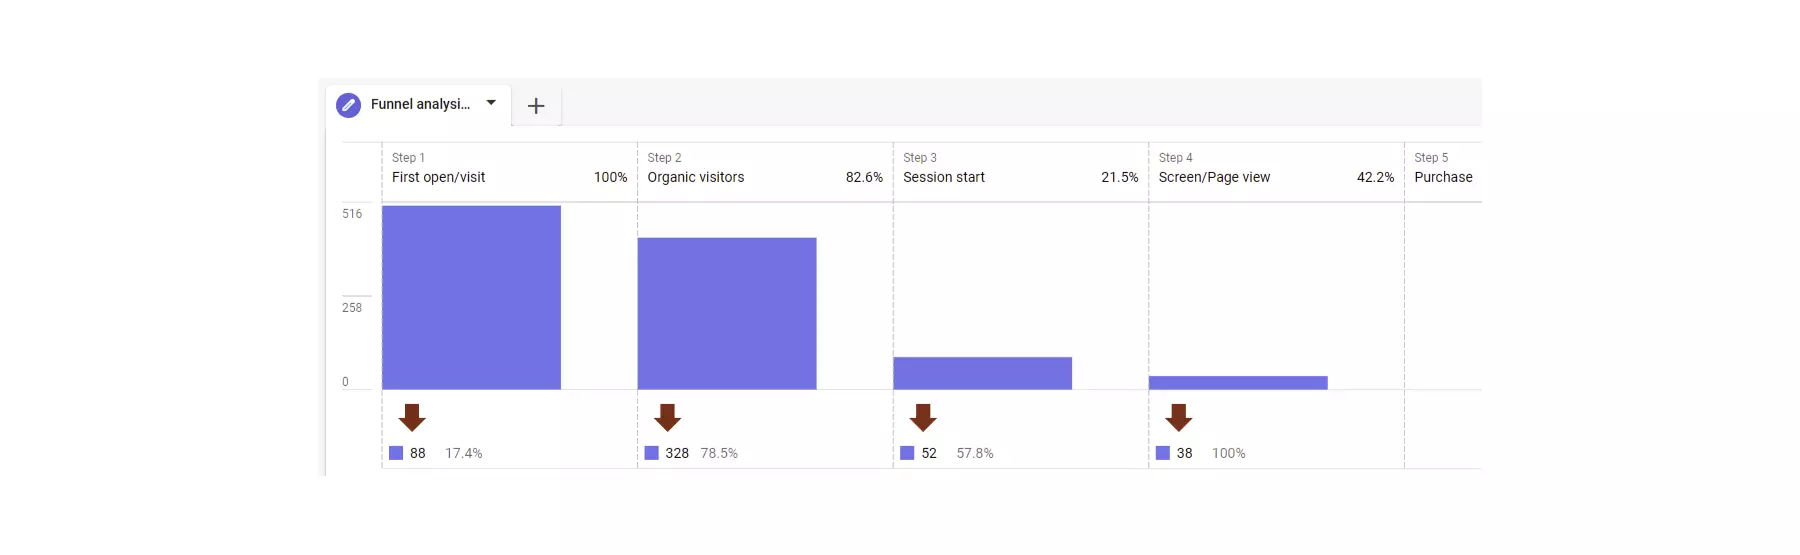
| Funnels are part of standardized reporting. | Funnels are created in the Analysis Hub only and have amazing reporting possibilities for someone more skilled as it is not that simple to create them. These analyses can be shared. |
| Each goal can have a single value, which then acts as a metric for that goal. | - |
| - | When using Audience, conversions can be created as a sequence of events. |
Events that are suitable for conversions can be created in the data collection JavaScript. You can derive them from existing events (after filtering) or create them from Audience membership creation. Conversion events based on Audiences can be even sequence-based.
Date & Time dimensions
| Universal Analytics | GA4 |
|---|---|
| Year, Week, Day, Hour, Minute, Hour of Day Dimension, and more are available. | Many Date/Time dimensions are missing and you are not able to go on granularity under YYYYMMDD. |
| If you need more precise collection time, you can set a custom dimension to hold the value up to the second. With only 50k unique values per day, it is not suitable for a high volume of events. | Until event collection date is available in API, you have to use custom dimension or Big Query Export. |
| You can retrieve dateHourMinute from the API. | The most granular time dimension you can retrieve from API is dateHour. |
| The hit collection time is up to the minute in BigQuery export (paid version only). | The event collection time event_timestamp is up to the millisecond in BigQuery exports (be careful with derived or audience-based events, where time is date of calculation). |
Subject identifiers
Subject IDs are unavailable in the interface for both versions, unless you duplicate them into a custom dimension. However, you can retrieve them from API or BigQuery.
| Universal Analytics | GA4 |
|---|---|
| Client ID - not available by default | Client ID - not available by default |
| Session ID - not available by default | Session ID - not relevant |
| User ID - not available by default | User ID - not available by default |
| Available in BigQuery export (paid version only) | Available in BigQuery export |
Data API
Universal Analytics’ latest API is V4, which often leads to confusion that the V4 is for GA4, and this is actually not correct. The latest version is Universal Analytics API V4 and GA4 API V1. Both APIs’ requests and responses are very similar.
Links
| Universal Analytics | GA4 |
|---|---|
| The API provides real-time and reporting functionalities. | The API provides real-time and reporting functionalities. |
| The API provides management functionalities. Not everything is possible to configure - you still need to go to the UI to configure things. | The API provides management functionalities. As the GA4 is different and still evolving, it is hard to tell how much it fully covers. |
| Quota management is based on the count of requests per time. | The Quota management to limit API queries is different. Instead of the count of requests, the complexity of the query is considered. The positive thing is that you can estimate the cost of a query before you execute it. |
| The filtering functionality is basic. Though not very often, you might be limited by this. | The filtering functionality is more complex and suitable. It is possible to create various AND/OR combinations. |
| The API allows four various request kinds: cohort, pivot, histogram, and a regular table. | The API allows for four various request kinds: cohort, pivot, histogram, and a regular table. The regular request is similar, Cohort is slightly improved and Pivot is implemented differently. |
| No new features are added. | New features are introduced quite regularly. |
| Sampling often affects the result, especially when there is too granular of a request. | Sampling is gone. |
| Segments can be used in the API. | Audiences can be used in filters. |
| There are 10,000 rows per request and pagination. | There are 10,000 rows per request and pagination. |
E-commerce
Both Google Analytics versions have a predefined set of e-commerce measurements. The huge difference is that in GA4 you are not able to visualize collected data in Default Reports. Luckily you can use Analysis Hub.
| Universal Analytics | GA4 |
|---|---|
| E-commerce events, Product Impressions, Product Clicks, Product Detail Impressions, Add/Remove from Cart, Promotion Impressions, Promotion Clicks, Checkout, Purchases, Refunds | E-commerce events, Product/Item List Views/Impressions, Product/Item List Clicks, Product/Item Detail Views, Adds/Removes from Cart, Promotion Views/Impressions, Promotion Clicks, Checkouts, Purchases, Refunds |
| Default Reporting - several different reports in the e-commerce section of the interface | Default Reporting is not available |
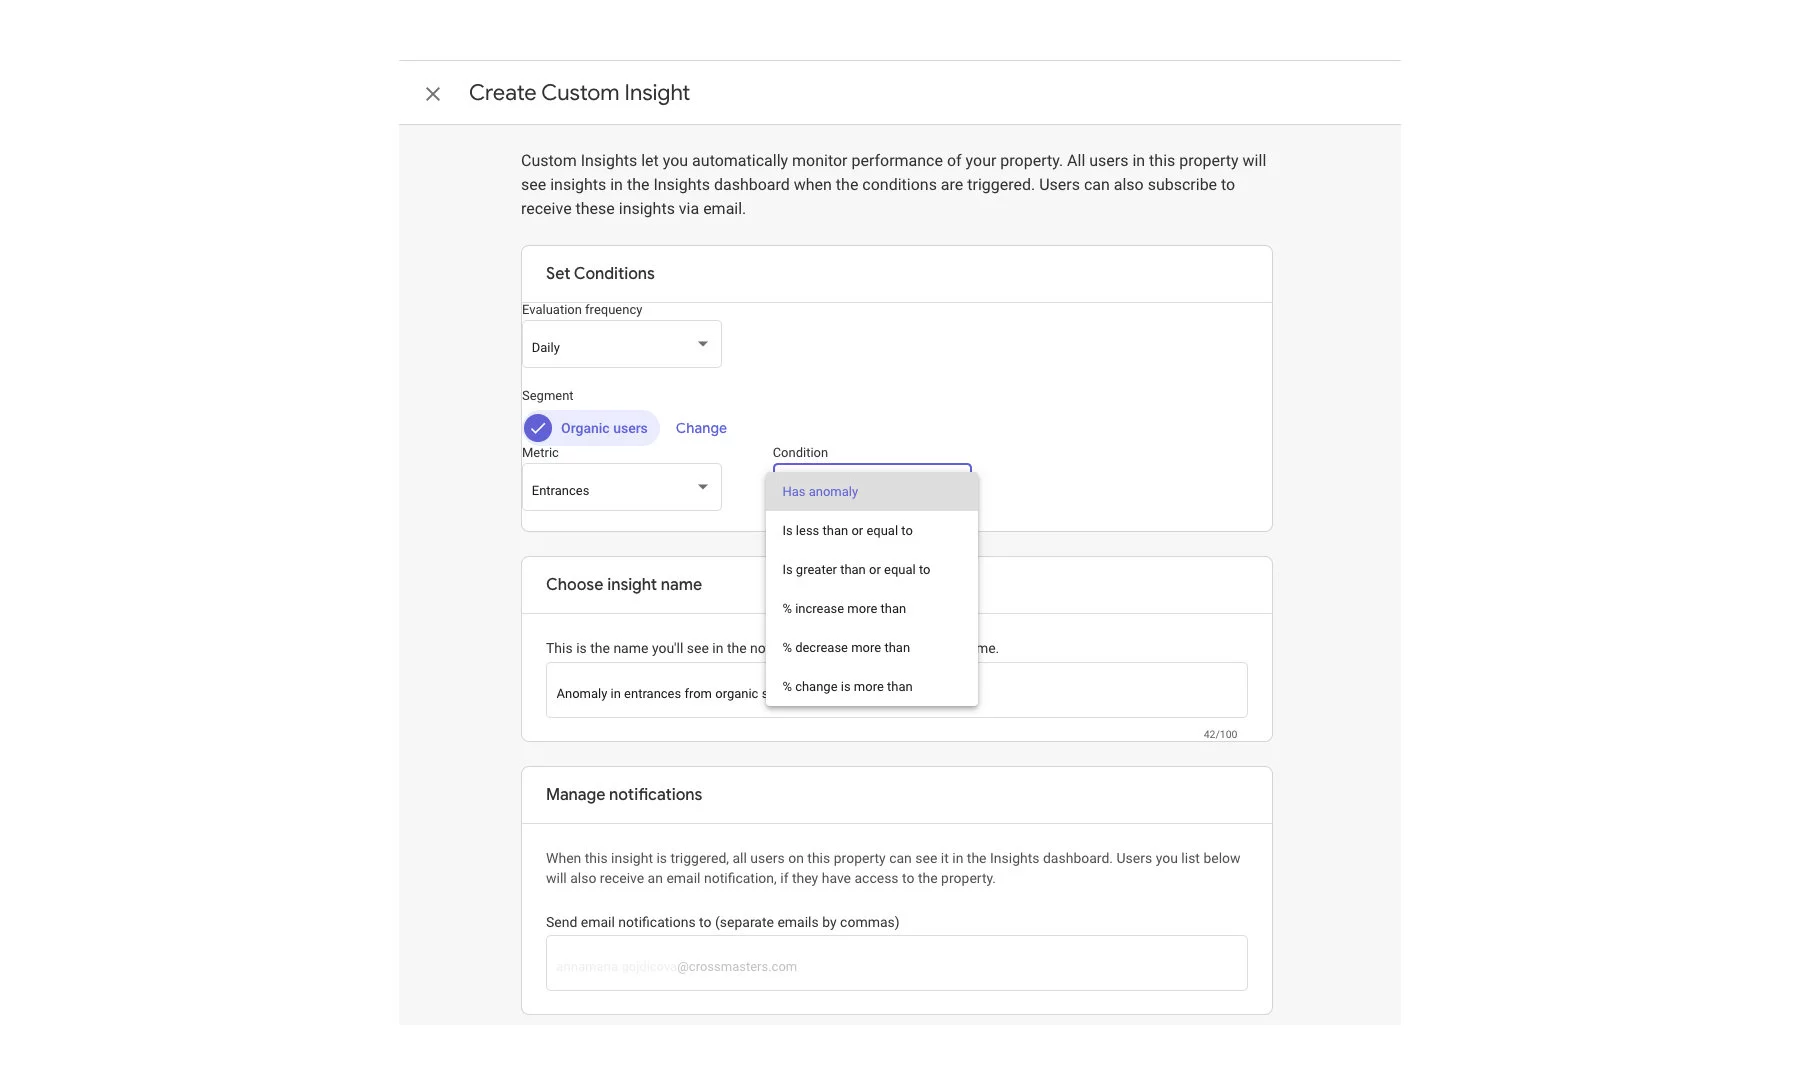
Alerts / Notifications / Custom insights
From our perspective alerting is an underused functionality. We saw many problems that could have been avoided with property configured Alerts. In addition to custom alerts, Google generates Notifications and Insights. As Notifications are mostly suggestions to upgrade to Premium versions and lack any practical use, insights are much more useful and do suggest some interesting facts. In GA4, alerts and insights merge into one feature and the tools assist a lot while creating alerts. Unfortunately, the UI is still limited in building more granular triggers. We also would expect more AI-driven functionalities and features, and Google-generated insights for our UA properties containing the same data, as we do send properties to GA4 that are not very useful. Maybe it is just a matter of where Google utilizes its computational resources, and GA4 still does not get enough.
| Universal Analytics | GA4 |
|---|---|
| Alerts - weak UI and configuration options, just rigid thresholds | Alerts are Custom insights, which provide much richer UI options, AI-supported alert creation, and anomaly detection. It is still not possible to have many granular triggers. |
| Notifications - overloaded with impractical information; No alerting possible for some important notifications | Notifications are not available. |
| Insights - interesting recommendations and quick UI navigations | Insights are Google calculated. For properties where we do collect identical data, GA4 insights are worse. Although the user interfaces in UA has the GA4 look and feel, it does not work that well in GA4. It is limited and does not provide such functionalities and AI-supported navigation. |
| Not possible to create Alerts over API | It is not possible to create Alerts over API. |
If you miss a more robust feature for incident detection you can try this tool.
Predictive analytics
UA is very limited in terms of predictive reports. There are only a few metrics that are calculated and we are often skeptical about their results. On the contrary, GA4 is much more intelligent. It provides a large set of predictive metrics which are available in the Analysis Hub. Compared to UA, the results look much more trustworthy. Although we used to calculate these metrics on the BigQuery ML modules for UA, now these are part of GA4. If you would like to utilize them outside GA4, there is no API available and even the documentation is sporadic in terms of how these are calculated. The lack of such features in UA made it seem more like a toy than a serious Web Analytics tool, so we are happy it has gotten more serious again.
| Universal Analytics | GA4 |
|---|---|
| Session Quality report (only available in GA 360) – evaluates sessions based on how close it was to a transaction. This is a posterior calculation and on the sessions level, we do not see much benefit there. | The Session Quality report is not available. As GA4 is user-centric and the UA reports are technically useless, we hope this will not be even included. |
| Conversion Probability report (only available in GA 360) – evaluates how close users are to transactions. As this is a posterior calculation, we do not see much benefit there. In many UA views where we evaluated these calculations, the results were often so skewed that we did not see any benefit there. | The Conversion Probability report is included in the predictive User Lifetime analysis. |
| External ML models - it is possible to easily calculate predictive metrics in BigQuery (360 version only) or external tools based on API extracted data. | Analysis Hub - the User Lifetime analysis technique provides a ton of various metrics, like churn prediction, Purchase probability, etc. |
| Anomaly detection is not possible. | Anomaly detection is possible. |

Google Cloud integration
We are really excited about this feature. We even decided to rate this section with two thumbs up. The free version of UA is very limiting when you need to export the data for other processing. Even though there are external tools that you use to export UA data into other database solutions, having an option to turn it on in GA4 is a huge plus. Of course, you will have to pay for BigQuery, but the prices are decent, between 10 EUR and 100 EUR for most websites. If you do not need to keep data for more than 60 days you can even have a free sandbox environment.
| Universal Analytics (Free) | Universal Analytics 360 | GA4 |
|---|---|---|
| BigQuery is not available natively, which means third-party tools need to be used. | BigQuery is integrated natively and you can enable one export per view. Both real-time and daily data are exported. | BigQuery export is integrated natively and you can enable one export per property. Real-time data can be streamed to BigQuery when billing is enabled. |
| Streaming events to another cloud consumer is not possible. | Streaming events to another cloud consumer is not possible. | Google Cloud Functions are integrated. Events collected can be in near real-time, streamed, and processed. This is an amazing functionality. |
Other Google products integration
The marketing ecosystem for an individual company consists of dozens of tools that, when integrated, provide much greater potential. Of course, there is a constant rivalry between the major vendors and you cannot expect Google to provide integration of competing technologies. It would be sufficient to at least be able to integrate all of the products from one vendor and this is the situation where GA4 provides horrible support. With the exception of Google Ads and the previously mentioned BigQuery, it does not provide any other integration. You can forget Search Console, which is not a big deal anyway, however the inability to connect Google Optimize is a huge deficiency.
| Universal Analytics 360 | GA4 |
|---|---|
| • AdSense • AdExchange • BigQuery (paid version) • Campaign Manager 360 • Display & Video 360 • Google Ads • Google Optimize • Postbacks • Search Ads 360 • Search Console | • BigQuery • Google Ads |
Data imports
Sometimes it makes sense to enhance or enrich Google Analytics data with data imports. For some clients who use an external database, or those who are cautious about providing sensitive data to Google, this has a little benefit. For those who use this feature a lot, GA4 provides very limited functionality. Not all UA imports are available now and the worst thing is that only manual imports are possible. We believe that imports will be enriched in the future.
| Universal Analytics | GA4 |
|---|---|
| • Refund data • User data • Campaign data • Geography data • Content data • Product data • Custom data • Cost data | • User data import (by client ID or by user ID) • Item data import |
| Manual upload | Manual upload |
| Automated upload | - |
Implementation
This section is special, and we decided not to make a comparison between UA and GA4. We assume that you are familiar with UA implementations so we just stressed the new approaches or areas where it is important to be careful.
There are 2 main options for how to implement GA4.
gtag.js
This approach has been available for more than a year and can be used for other Google products, like the previous version of Google Analytics UA, Google Ads, or Double Click. If you have gtag included in your application, you can start using it for GA4 as well. Of course, you have to identify all of the events you want to collect manually.
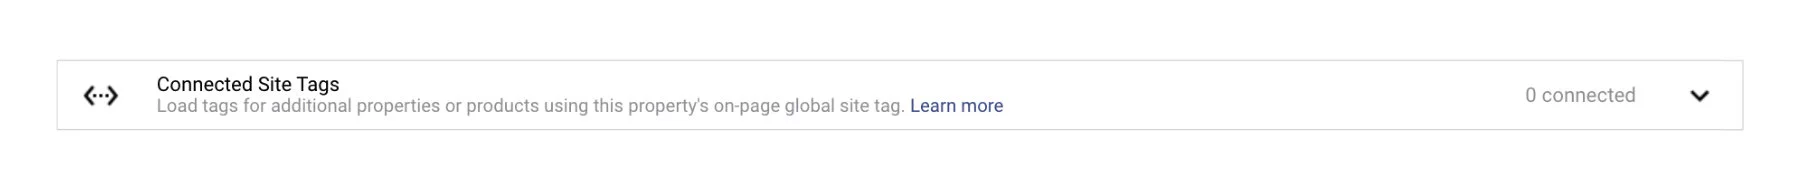
Connected site tags
This method offers a very fast integration of existing measurements. GA4 can listen to your existing UA measurements implemented by gtag. You can start listening by providing the property ID into the connected tag configuration. This is also very handy when you would like to test your configuration first.
Google Tag Manager
Setting up GTM for GA4 is very simple unless you want to measure something extra. As the whole logic is hidden in the tag, you just use the Stream ID (Measurement ID) and configure the corresponding templates.
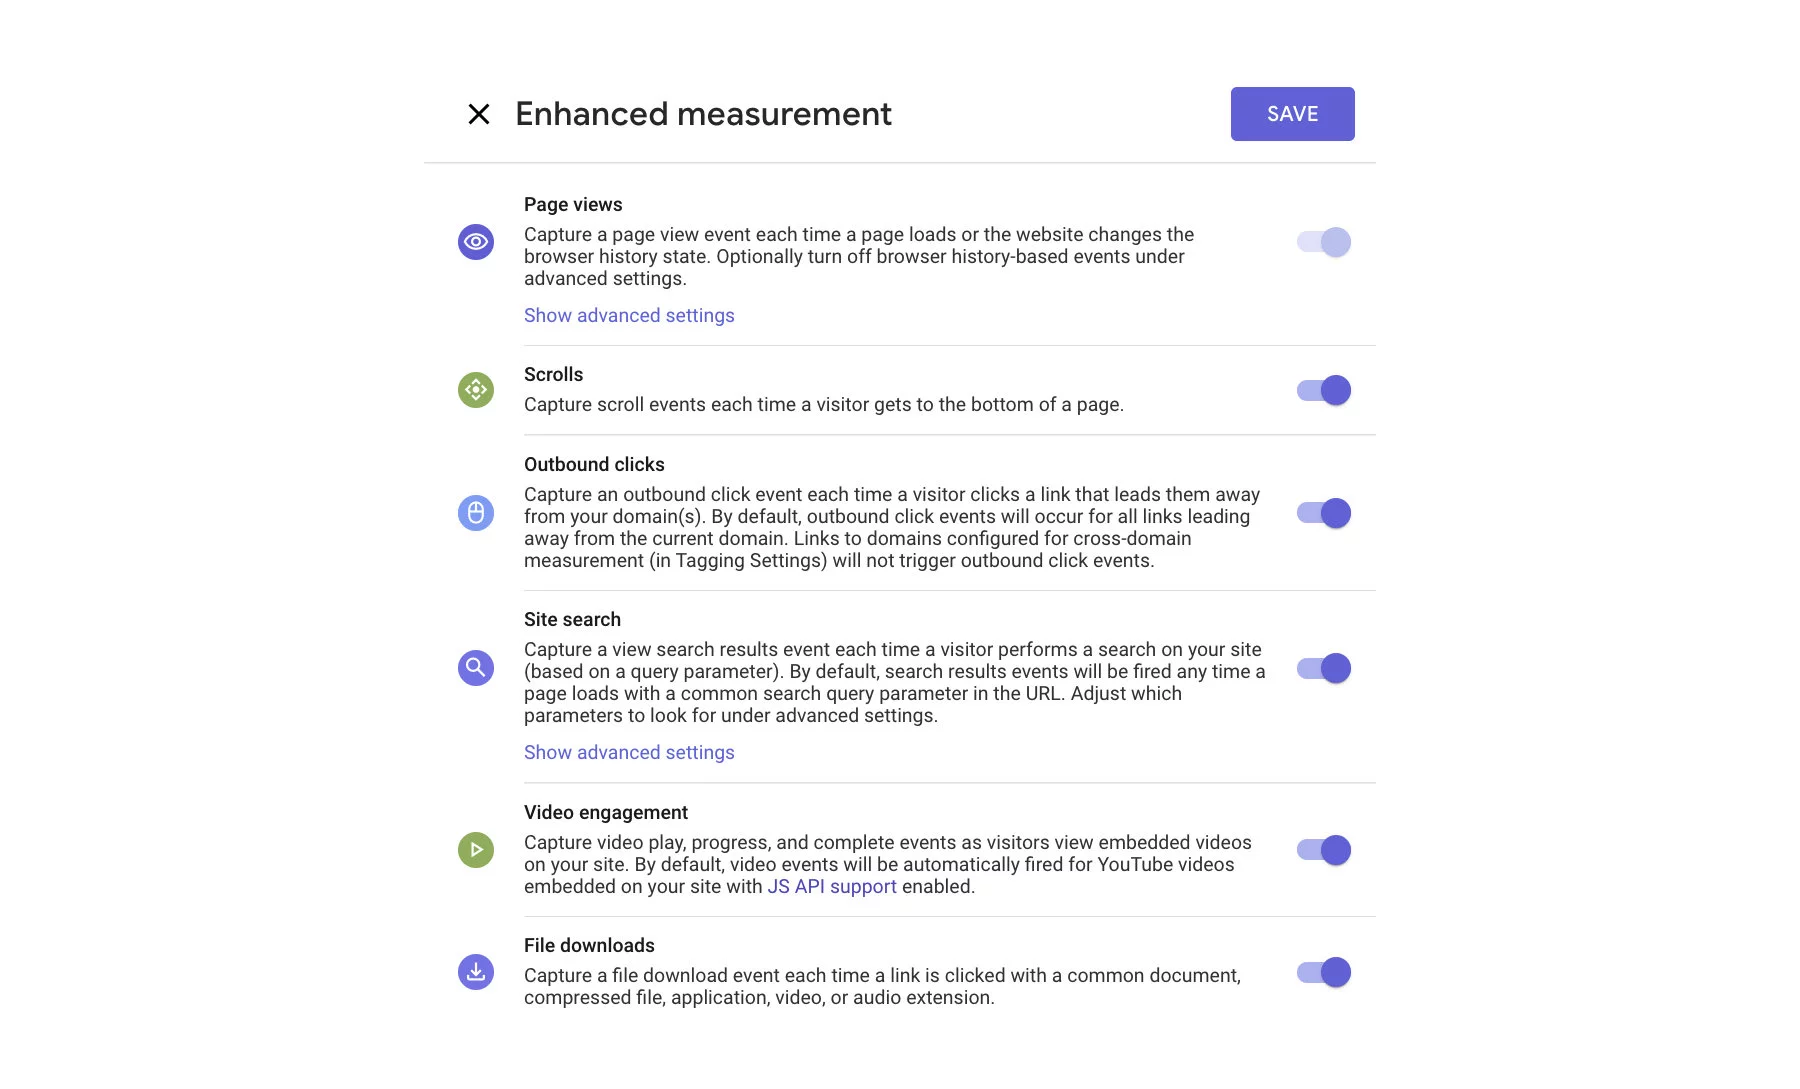
Enhanced Measurement
An exciting part of GA4 is called Enhanced Measurement. In the settings of your GA4, you will find data streams which are measurement streams from several sources.
For the web stream, you will find the Enhanced measurement setting. You can set many commonly used measurements with this setting, such as scroll measurement, outbound clicks, and more. Also, the tracking script gets automatically updated.
Debugging
In UA, you could either check the measurements directly on the website using various browser extensions or in the real-time view. Validating measured results fully requires you to wait for a few hours or even a day. Any changes you wanted to verify were limited by these time delays.
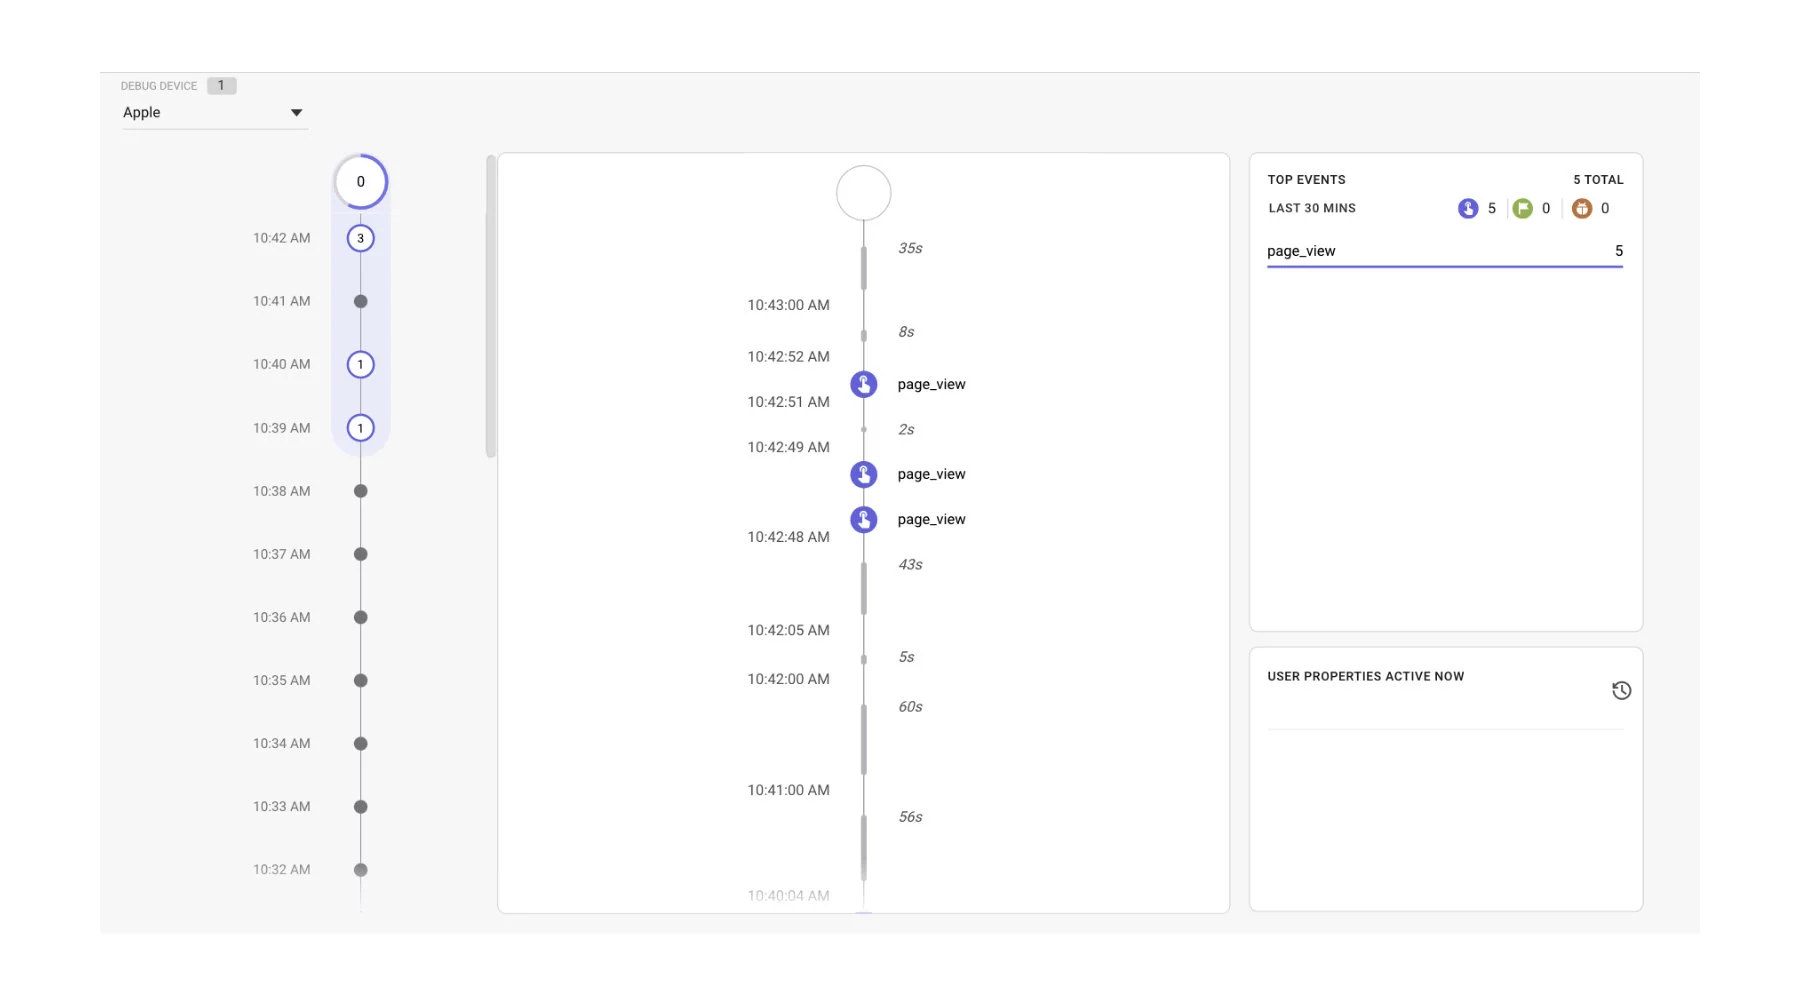
GA4 is very advanced in this regard. You can do more on validation and assure higher quality data. Part of the GA4 is a tool called Debugger, which can be found directly in the main menu. To activate it you must visit your web page with ?gtm_debug=x parameter. This will render a dialog in the lower right corner that will tell you more.

After you start an activity, events will flow into your debug view in the GA4 interface.
Summary
Although we have spent a huge number of hours on GA4 testing and consolidating our findings into this article, it is still not a full comparison list. Between the time we started writing it and now, many things have already changed. As the new Google Analytics version is continuously being updated, it might be that some missing features or functionalities were already introduced.